Life in Weeks
A free life calendar. See how many weeks you have lived, and how many an average lifespan still holds.
Free, and nothing you enter leaves your browser.
My Life in Weeks
karanbhakuni.com/life-in-weeks
a week already lived the week you are in a week not yet lived
On what you are looking at
Significance is assigned later, and usually by someone else.
No one remembers being three. The first two hundred squares are gone, and yet those weeks settled the sound of your own name inside your head, which rooms feel safe, what a hand on your back means. The same happens further along. The week you met the person who changed everything felt like a Tuesday with weather in it. The week a friendship quietly ended contained no ending, only a message you meant to answer. A week feeling ordinary is not evidence that you are doing this wrong.
The weeks behind you are the one part nothing can reach.
The first thing many people feel is the weight at the top of the grid, all that color already spent. But the filled part is the only part of a life that is finished. Nothing that comes later can reach back and undo it. The grid also cannot tell which of those weeks you chose and which ones simply happened to you, the illness, the waiting, the year that was mostly getting through. It was never keeping that kind of record.
Repetition is not the opposite of a life. It is the material.
Look at any stretch of the grid and you will find long runs that were, as far as you could tell, copies. The same commute, the same three meals, the same argument in slightly different words. But nobody comes out of a hundred identical weeks as the person who went in. Skill accumulates there. So does love, and health, and whatever people mean when they say someone has become themselves. The squares repeat. You do not.
You were allowed not to notice.
Somewhere in the filled part of this grid is an ordinary evening with someone who is not here anymore. A phone call you cut short because you were tired. You did not know, and you were not supposed to know. If every dinner were held as though it were the last, no one could eat. You are the last copy of that evening now, the way you are the last copy of a joke someone made in a car in 2011 that nobody else on earth still knows.
You are standing in one of these right now.
This week has a square. It will probably feel like nothing, and that is not a failure of the week. A week only shows its full worth from the far side of itself, and that is the price of being able to live inside one. You do not have to make it count. Counting is not something weeks ask for. The square you are in is the same substance as every square you would call precious.
Close the page and the grid goes back to being invisible, which is how it has always run. Nothing here is asking you to change anything. You are not behind. There is no rate at which these are supposed to be spent, and nobody grades you on how you fill them.
Almost every week anyone has ever lived went unrecorded. A life can be real without being remembered, even by the one who lived it.
The week you are in, the forgettable one you would not think to describe to anyone, is not the space between the parts of your life that matter. It is what your life is made of. There was never going to be anything else.
A week is the unit you can still feel
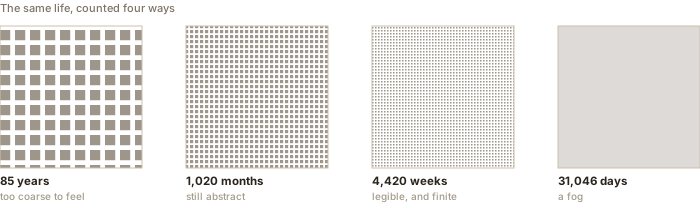
Count a life in days and the number is too large to mean anything. Thirty thousand of something is not a quantity. It is a fog.
Count it in years and the number is small enough to fool you. Eighty is a shelf of books you assume you will get around to reading.
The week is where arithmetic and feeling meet. Four thousand of something is a figure you can hold, and you know exactly what a week is, because you just finished one. The Monday. The middle. The evening it rained.
A week is also the unit that holds other people. Ask anyone how often they see their brother and they will answer in weeks or they will answer in years, and the distance between those two answers is the whole state of the relationship.
It is exactly the size of a routine, too. Anything that fits inside one can repeat forever without becoming a story.
The grid above is not my invention. Tim Urban drew it at Wait But Why, ninety rows of fifty-two, and anyone who thinks in weeks now is borrowing his picture. It sets the weeks beside each other and makes them look like what they are: ordinary, countable, finite.
Most of the grid is spoken for before you choose anything
Eighty-five years is 4,420 weeks if you round a year to fifty-two. The grid above uses that number, so I will too.
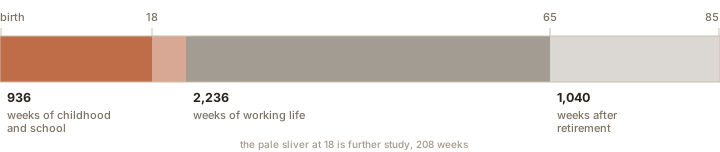
The bar below splits it by phase.
Childhood and school, birth to eighteen, is 936 weeks. Exactly one fifth of the whole. The first 260 are gone before a child sets foot in a classroom.
The working years, twenty-two to sixty-five, are 2,236 weeks. A little under half of everything.
The years after sixty-five are 1,040 weeks, close to a quarter of a life and longer than childhood.
All of childhood is 936 weeks, and if you are raising someone that is the entire budget. It is not renewed. The last band is longer than most people picture, too. The years after work are not an epilogue. They outlast everything before you left school.
One correction, said once and set down. Even eighty-five is optimistic rather than typical. Life expectancy at birth in the United States was 79.0 years in 2024, a record high, which comes to about 4,120 weeks. The default grid here is already about three hundred squares more generous than an average life, and the ninety-year version you see elsewhere is more generous still.
The free hours are fewer than you think, and that is not a failure
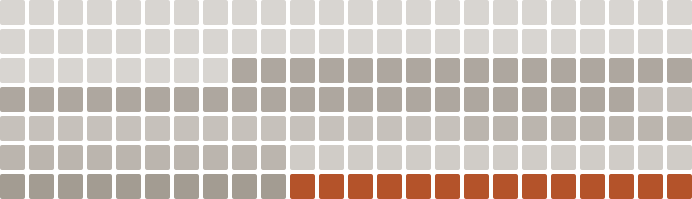
A week is 168 hours and every one of them goes somewhere. Each square below is one hour.
The American Time Use Survey asks people to account for a day, hour by hour. Multiplied out to a week, its 2025 averages for Americans aged fifteen and over read like this. Personal care, most of it sleep, takes 68.6 hours. Paid work takes 23.2. Housework and cooking take 13.9. Eating takes 8.5. Errands, shopping and looking after other people take 9.3 between them. Study, worship, calls and the rest account for about 8 more.
Leisure and sport get 36.1 hours. That is the free block, and half of it, 18.3 hours, is television.
Three cautions. The sleep figure is time in bed, naps and sleeplessness included, rather than sleep obtained. Asked directly, 30.5 percent of American adults report averaging under seven hours. Travel is folded into whatever activity it serves, so the average one-way commute of 27.2 minutes already sits inside work and cannot be counted twice. And only your main activity is recorded, so the phone in your hand during the television hour appears nowhere.
The average holds retirees and teenagers, too. Employed people have 29.2 free hours a week. An employed parent of a preschooler has 24.7. Someone over seventy-five has 51.7. Three rows of the same table, and the difference is not discipline. It is which part of a life you happen to be standing in.
None of this is an emergency. Most of the 168 is sleep, food, work and the upkeep of a life, and none of it is waste. Rest is not the opposite of living. Knowing the true size of the block you choose is what stops a tired Wednesday feeling like a failure.
The company thins early, and then it stays thin
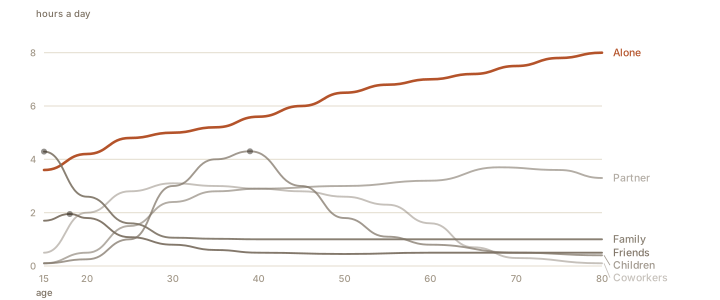
The curves below come out of the same survey, read a different way. It asks not what people were doing but who was physically in the room. Calls and messages count for nothing here, a real omission in this century. Read the lines as company, not as love.
Time with friends peaks at eighteen, at 1.95 hours a day. By twenty-five it is 1.08. By forty it is half an hour, and it stays there for the next forty years. Almost all of that happens in your twenties. There is no week in which a person decides to stop seeing their friends. The curve simply bends, one reasonable Tuesday at a time.
Time with family, meaning parents and siblings and relatives together, is already at its highest at fifteen, 4.29 hours a day. By thirty it is 1.06, and then it holds near an hour for fifty years.
Coworkers rise to meet you and peak at thirty. Children are a spike rather than a plateau: near zero until the mid-twenties, a peak of 4.30 hours a day at thirty-nine, then a fall as steep as the climb. A partner holds near three hours through the middle decades and rises again in retirement.
One line rises the whole way. Time alone is under four hours a day at fifteen, six and a half by fifty, close to eight by eighty. After eighty, women average 8.45 hours alone and men 7.34. Men tend to die first, and women tend to finish the story by themselves.
Alone is not the same as lonely. A great deal of solitude is chosen and good, and the chart cannot tell the difference. On an ordinary Tuesday I am not certain I can either.
The curves cannot predict you, either. They pool many annual surveys, so they show what eighty-year-olds do now, not what today’s twenty-year-olds will do at eighty. A pattern, not a sentence passed on anyone.
Most of the time with them is already behind you
In December 2015 Tim Urban published The Tail End, a small piece of arithmetic about his own family. He had been around his parents on most days of his first eighteen years. After he left for college, about ten days a year. Allowing thirty more optimistic years of that, he had used roughly 93 percent of his in-person time with them before he finished high school.
The number traveled further than the essay, so handle it carefully. It is one man’s estimate of one man’s life, and he never claimed otherwise. It counts days of contact rather than hours, which flatters the childhood side. A school day might hold four waking hours with a parent. A visit home holds twelve. Recounted in hours, the same scenario lands between 75 and 90 percent.
The correction rescues nobody. It only makes the claim survivable as a fact rather than a shock.
The survey curves agree about the shape without confirming the number. By my own arithmetic on them, half of all family time between fifteen and eighty is spent before thirty-five.
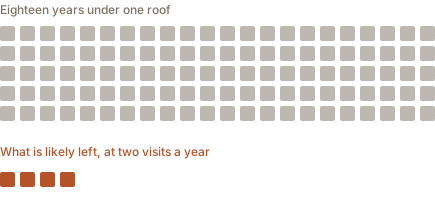
So here is the version I trust. By the time a child leaves home, most of the days they will ever spend under one roof with their parents are already behind them. What is left arrives in visits.
The cluster below is that counted: visits a year, times the years you can reasonably hope for. For most people living a flight away it comes out in dozens.
The model is crude. It has no room for the year you move back, or the months of care at the end. It counts rooms, not love, and a phone call every Sunday is not nothing.
I am not going to tell you to move home. Distance is rarely a preference. It is a job, a visa, a marriage, a life built where it could be built, often for them.
What the number is good for is smaller than guilt, and more useful. Stay the extra two days. Call on a Tuesday for no reason, even though the survey does not count phone calls, because a survey is not your mother. Ask the questions you assume you will get around to asking.
Somewhere in that small cluster is a last unremarkable afternoon in that house, tea going cold, someone asking about your work for the fourth time. Nothing will mark it. You will be inside it rather than counting it, which is the right way to be inside it.
If your parents are already gone, the dots are not a warning. They are a record. Nobody has ever spent a finite thing perfectly, and you were never going to be the first.
The visits that remain are countable. Countable things can be spent well.
There is no correct week to do the thing you are for
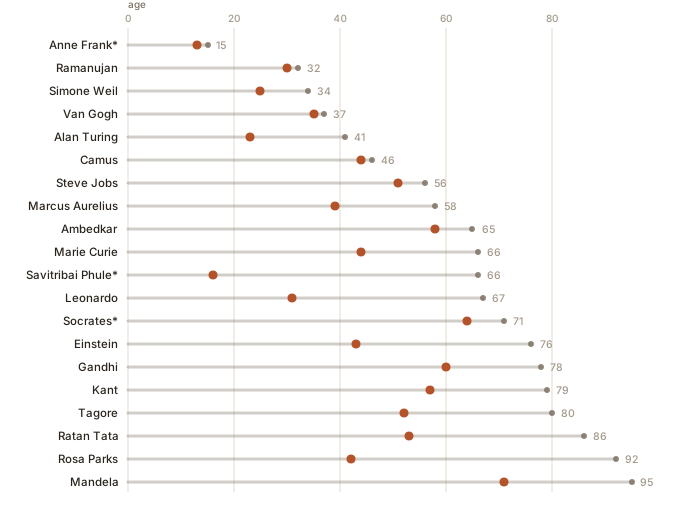
Below are twenty lives, sorted by how long they lasted, with a mark on each at the age the person did the thing they are remembered for.
Anne Frank was given the diary at thirteen and had fifteen years in total. Ramanujan was elected to the Royal Society at thirty and died at thirty-two. Savitribai Phule opened her school at sixteen and lived another fifty years afterward. Mandela was seventy-one when he walked out of prison, with a quarter of a century still ahead of him.
The marks do not cluster. They are scattered across the whole width of the chart, which is the only honest answer to the question of whether you are behind.
The years blur because they stopped disagreeing with each other
The sensation is real. Several thousand people across five countries report the same thing: the last decade went somewhere without being noticed.
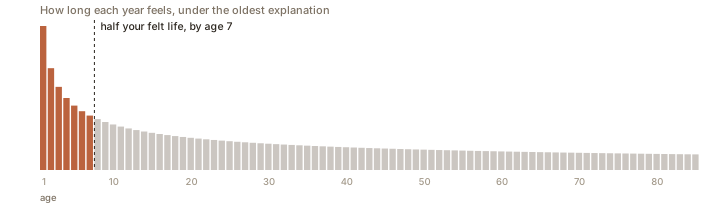
The oldest explanation belongs to Paul Janet, in 1877. Each year is a smaller fraction of the life already lived, so each one feels shorter. William James repeated it in 1890 and then refused to believe it, calling it no elementary law of the mind and blaming instead the sameness of what memory is given to hold. Newer explanations from neuroscience are no better tested. After a hundred and fifty years this is an intuition, not a finding.
What has been measured is smaller and more interesting than the folklore. Wittmann and Lehnhoff surveyed 499 people aged fourteen to ninety-four, found the effect real, and found that age accounted for at most ten percent of the variation. Ninety percent of why your time feels fast or slow has nothing to do with how old you are.
A larger study, of 1,865 adults, found something sharper. The age effect appeared only in judgments about the previous ten years. People do not say last week went faster than it used to. They say the decade did.
Which tells you where the leak is. Not in the day. In the record of the day.
That is the one thing a grid is good for. It puts 520 separate squares where memory keeps a single word. It cannot slow anything down. It just will not let a year collapse into the sentence you use about it at parties.
The ordinary week is where the whole thing is kept
None of this asks anything of you.
Measuring a life does not improve it. Nobody arrives at the end wishing they had been more efficient with the leisure block, and the people who most need a gentle week are usually the ones being told to optimize one.
What the counting restores is proportion. Childhood is 936 weeks. An employed adult has 29.2 free hours in a week, and television takes about half of them. The visits home fit on a single page.
The week you are in looks like nothing at all. A Monday you resent. An evening that gets away from you. Laundry. A conversation you nearly skipped. It is a unit of your life regardless, and it is exactly long enough to see someone.
A week is too long to feel urgent and too short to become a story. It is also the only piece of a life anyone is ever handed.
You are holding one now.
Questions
How many weeks are in an average life?
About 4,420, if you take eighty-five years as the span. At ninety it is 4,680, at eighty roughly 4,160, and at seventy-five about 3,900. The number is smaller than most people expect, which is part of why seeing it laid out changes something.
How do I work out how many weeks I have lived?
Take the days between your birth date and today and divide by seven. The calculator above does it for you and then draws the answer, which is the part worth seeing. As a rough shortcut, your age in years multiplied by fifty-two lands close.
What is a life calendar?
A life calendar is a single chart where every box stands for one unit of a lifetime, usually a week, so a whole life fits on one page. It became widely known through the idea that a life is roughly four thousand weeks. Seeing them all at once does something no number on its own manages.
Is my data stored or sent anywhere?
No. The whole calculation runs in your browser. There is no server, no account, no analytics on what you enter, and nothing is saved when you close the page.
Where does the idea of counting a life in weeks come from?
It belongs to the long memento mori tradition, the practice of keeping mortality in view in order to see the present more clearly. The Stoics kept it close, and it has since found its way into modern writing about attention and time. The grid is just an old idea given a shape you can look at.
What life expectancy should I enter?
Eighty-five is the default here because it sits a little above most national averages without being fanciful. It is not a prediction. Change it to whatever feels honest to you. No number in this tool knows anything about your actual life, and it is not trying to.
Is this calculator free?
Yes, completely. No sign up, no email, no payment, no limit on how many times you use it.